Key Factors Tied to Congestive Heart Failure Patients’ Survivability
This link is to a Kaggle post that explains in detail how cardiovascular diseases are the #1 cause of death globally and the many things that may have an impact on it.
Heart failure is a very common event caused by cardiovascular diseases and this dataset contains many variables that can be used to predict mortality rate in the case of heart failure.


Comprehending our data…

The dataset that I chose contained the following information that will be used:
- Anemia: Decreased amount of red blood cells/hemoglobin
- Diabetes: If the patient is diabetic
- Ejection Fraction: Rate blood is leaving the heart at
- High Blood Pressure: If the patient has hypertension
- Creatinine Phosphokinase: Amount of CPK enzyme in the blood (mcg/L) kree-a-tuh-neen
- Platelets: Amount of platelets in the blood (kiloplatelets/mL)
- Serum Creatinine: Levels of creatinine in the blood (mg/dL)
- Serum Sodium: Levels of sodium in the blood (mEq/L)
- Sex: Gender of the patient, woman or man (0 or 1)
- Smoking: If the patient was a smoker, yes or no (0 or 1)
- Death Event: If the patient lived through their heart failure, deceased or survived (0 or 1)


From this we can see that is no missing data points in out dataset, we also can tell that there is a total of only around three hundred entries total. Meaning that this dataset may be limited in that it will produce large standard errors.
Cleaning our data…
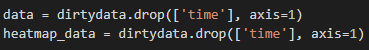
The time variable in this case is related to when the report was made and does not impact the mortality rate so it will be the only variable that gets dropped.
age: will now appear as ‘Age’
anaemia: will now appear as ‘Anemic’
creatinine_phosphokinase will now appear as ‘CPK’
diabetes: will now appear as ‘Diabetic’
ejection_fraction: will now appear as ‘Heart_Beat_Rate’
high_blood_pressure: will now appear as ‘HBP’
platelets: will now appear as ‘Platelets’
serum_creatinine: will now appear as ‘Creatinine’
serum_sodium: will now appear as ‘Sodium’
sex: will now appear as ‘Sex’
smoking: will now appear as ‘Smoker’
DEATH_EVENT: remains ‘DEATH_EVENT’

Feature engineering used…
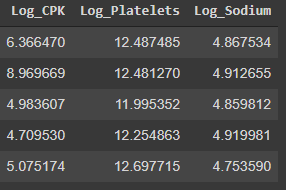
Three of the variables that I wanted to test had values that were extreme cases of being outliers, therefore skewing my results by quite a large amount. To combat this I took the logs of the three and made new columns to be tested.
Testing our data…
For this test I started out just by logically thinking about what method would give use the best results, in this case since were comparing the populations of two groups we will want to use a chi squared test, which will look like…
𝐻0: 𝜇1 Patient w/ one condition= 𝜇2 Patient w/o
𝐻𝑎: 𝜇1 Patient w/ one condition ≠ 𝜇2 Patient w/o
The variables that will be ran through the test to see correlation:
- Anemia
- Diabetes
- High blood pressure
- Smoking
- Sex


After testing all different cases, the ones with high blood pressure turned out to be the least statistically significant calculation. With our p-value being ~.21 we’re way below the alpha level we have set at 0.05. So we have to fail to reject the null hypothesis and accept the alternative that having a condition makes you more likely to not survive.
With high blood pressure being a good contender to play a role in whether the patient survives or not let’s take a look at the another correlation.


With a p-value being 3.443813549470809e-14 we’re even further below the alpha level now. So we have to fail to reject the null hypothesis and accept the alternative that having anemia is a statistically significant factor in whether or not a patient lives through their heart failure.

Here we can see these plots that visually demonstrate how large of a variation in results we have when testing for trace amounts of substance in the blood.

Conclusion…
I assumed at the start that the categorical data, like anemia, diabetes, high blood pressure and so on would have a strong correlation to whether or not a person lived and that proved to be in fact true, sadly. The data shows that a person with a condition prior to their heart failure is nearly two times more likely to pass away.
I also made the assumption that the quantitative variables like, levels of enzymes that were being measured in the blood would have a strong correlation to if the patient were to survive or not but none of them really did. This could be related to many different things. Including the fact that conditions like diabetes may be contributing to low level amounts of sodium.
From these simple tests were able to see many important signs about our patients and their outcomes. One of the main factors being that what the person is predisposed to before their heart failure is significantly more important that the data that is reported from when and after it happens.
In conclusion it is very apparent that having just about any condition prior to a heart failure, lowers your survival rate immensely. Beyond this discovery, it raises the question of if the quantitative variables like amount of enzymes in the bloodstream could possibly be correlated to the condition that the person has.
Below is a list of articles that discuss other’s reports that link anemia as well as high blood pressure to heart failure, also possible ways of detecting this issue/therapies that are emerging for it:
Anemia in Chronic Heart Failure
